At the Center for Curriculum Analysis, "content" is defined by the intersection of content topics and cognitive skills (similar to the cognitive levels in Bloom's Taxonomy, or Webb's Depth of Knowledge framework). Teachers who understand how to differentiate content in terms of both topic focus and cognitive skill are better able to target instruction and engage students in learning activities that reflect both the topics and relevant cognitive skills emphasized in standards and assessments.
Consider the teaching of fractions in the elementary grades. Many students get a lot of drill and practice solving bare equations such as:
Solve. ½ + ½ = ?
Fewer students are asked to do tasks like the following:
Explain what ½ means.
For the typical 3rd or 4th grader, the first task may be routine, but the second task requires more thought. Students who can handle the second task can probably do the first, but the reverse is not necessarily true.
In the world of elementary math instruction, the first task is like a nail. And we give students a lot of practice with using standard procedures to hammer such nails. The second task is more involved, like a dove-tailed joint, which requires more knowledge and the right tools. Students equipped with only a hammer will have little success constructing one. Students that are given the opportunity to practice a diverse set of cognitive skills in the process of learning new content are better prepared to demonstrate their understanding of academic content on rigorous assessments.
The table below shows the cognitive demand categories used by the CCA to content analyze things such as classroom tasks, classroom instruction, standards, and assessment items in science. Some representative descriptors are listed for each category.
| B | C | D | E | F |
|---|---|---|---|---|
| Memorize Facts/ Definitions/ Formulas | Conduct Investigations/ Perform Procedures | Communicate Understanding | Analyze Information | Apply Concepts/ Make Connections |
|
|
|
|
|
Try your hand at content analyzing a sample science assessment item below to get a feel for how cognitive demand (CD) is embedded in content. If you choose more than one CD category, think about which category, if any, gets the greatest emphasis in the item.
Hint: Most analysts find it helpful to complete a task before choosing CD categories.
After you chose your CD categories, you can click on the Sample Item CD Codes button to see what CD categories were chosen by an experienced SEC content analyst.
Sample Science Task 1. (Grade 7)
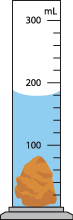
If the volume of the rock immersed in the graduated cylinder is 60 mL, what will the level of the water be after the rock is removed?
- 30 mL
- 90 mL
- 120 mL
- 150 mL
Primary Emphasis:
Category C: Conduct Investigations/Perform Procedures
(Especially Make measurements, do computations)
Secondary Emphasis:
Category E: Analyze Information
(Especially Make predictions and Infer from data)
To learn more about how CCA tools use Cognitive Demand in conjunction with Topics to provide a visual description of the content of classroom instruction, click here.
Contact us to schedule a content analysis training workshop, or to learn more about analyzing materials used to support instruction and assessments in your school or district.
An important tool available through the Center for Curriculum Analysis is Content Maps – easy to read graphics that provide a 'description' of the content emphasis pattern of an individual or group of teachers for a lesson, unit, semester, or school year. Teachers and other instructional leaders use Content Maps to discover content emphasis patterns that are often lost in the hustle and bustle of school life.
The Content Maps below show how one Grade 10 Algebra II teacher distributed her instructional time across an entire school year. A coarse grain map (left) describes how time was allocated across the 16 big content domains in mathematics, and a fine grain map (right) shows how the time devoted to Advanced Algebra was distributed across the 13 sub-topics within Advanced Algebra.
Your Grade 10 Algebra Results
Advanced Algebra (fine grain)
For more on cognitive demand and its importance in the SEC, click here
Content maps tend to resemble a bird's-eye view of islands in an ocean. Incrementally darker colors are used to represent increasing amounts of instructional time, similar to progressively higher elevations on islands on a topographical map.
The content map on the left shows that this teacher gave the greatest emphasis to teaching content in the area of Advanced Algebra, at the cognitive demand level Demonstrate Understanding. The map on the right shows that Rules for Exponents received the most instructional time of any sub-topic in the Advanced Algebra domain. Again, the teacher emphasized Demonstrate Understanding more than other cognitive demand levels.
In addition to providing teachers with content maps of their own classroom instruction, the CCA database can display similar maps of standards, assessments (national, state, or classroom), textbooks, and so on. Teachers compare their own content maps to ones for their state standards, for example, to see how well their instruction aligns to the standards. Using these tools to reflect on alignment helps teachers to distinguish between areas in which instruction is on target versus where their students may benefit from increased or decreased instructional emphasis.
Are you ready to optimize the alignment of your classroom instruction to your standards?
For more information about CCA alignment tools and how they help teachers and instructional leaders get the most out of reflecting on their professional practice, click here.
Are you ready to optimize the alignment of your classroom instruction to your standards? Contact us to get started.
The Personal Alignment Report (PAR) employs easy-to-read graphics to step individuals or groups of teachers through a comprehensive review of the similarities and differences between their instructional content and that of their state standards (or other relevant instructional targets that teachers may select) for their subject and grade.
Sample Topic Coverage Chart
| Instruction | Standards | |
|---|---|---|
| Characteristics and composition | ||
| Elements, molecules, and compounds | ||
| States of matter (S-L-G-P) | ||
| Solutions and mixtures | ||
| Physical and chemical changes | ||
| Physical and chemical properties | ||
| Isotopes, atomic number, and atomic mass | ||
| Photons and spectra | ||
| Atomic theory | ||
| Quantum theory and electron clouds |
Sample Cognitive Demand Chart

"We used the science SEC and were for the first time able to see where our instructional emphasis is placed and open up the kind of dialogue that allows us to move towards a standards based approach to teaching…"
The Personal Alignment Report (PAR) assists teachers in identifying areas of instruction that may be over- or under-emphasized based on their own determination of student learning needs and curricular goals.
- Topic Coverage (TC)
The degree of match between topics in your reported content and the topics emphasized in the standards. - Balance of Representation (BR)
The extent to which you address standards-based content compared to the relative emphasis given to that content in the standards. - Cognitive Demand (CD)
The extent to which your instruction matches the standards in terms of the level of emphasis placed on five categories of cognitive demand. - Overall Alignment Index (OAI)
A stringent, research-based alignment measure that summarizes the extent to which classroom instruction matches the standards when measured at the intersection of what is taught, how much, and to what level of cognitive demand.
Alignment Summary
| TC | BR | CD | OAI |
|---|---|---|---|
| 0.56 | 0.21 | 0.74 | 0.48 |
Note: 0.50 or higher indicates good alignment to the target for that measure.
Sample PAR Content Maps
Content Maps bring all 3 alignment dimensions (topics, cognitive demand, and relative emphasis) together in a single display, reporting the relative emphasis placed on content at the intersection of each topic and cognitive demand category. (For the basics on how to interpret content maps, click here.) In the PAR, content maps of instruction and standards are placed side by side to facilitate comparisons of similarities and differences.
In this example, a Grade 8 science teacher's classroom instructional content for one school year is compared to her state science standards for Grade 8. In this state, Grade 8 science spans Physical, Earth, and Life Sciences.
There are several content domains that get considerable emphasis in one map and little or nothing in the other. For example, the teacher devoted considerable time to Components of Living Systems and Elements of the Periodic System even though these domains get little or no attention in the standards. Conversely, whereas the standards give significant attention to Human Biology and Genetics, the teacher reported little instruction in those domains. Such instances of non-alignment made the teacher's Overall Alignment Index (OAI) lower than it otherwise would have been.
Content domains that get considerable emphasis in both maps and therefore helped raise the teacher's instructional alignment include Science, Health & Environment, Ecology, Properties of Matter, and Earth Systems. However, alignment was not complete within those domains due to differences in cognitive demand emphasis. For example, in Ecology, the standards emphasize Communicate Understanding and Investigation, whereas the teacher placed the most emphasis on Recall.
Such data enable teachers to determine if their instruction is adding up as intended over time. The PAR meets the needs of teachers, grade level teams, departments, schools, districts, and states by providing sharable alignment reports for groups of teachers (e.g., middle school science teachers) as well as confidential reports for individuals.
Used in conjunction with the system's Content Analysis Module (CAM), teachers are able to take formative assessment to a whole new level by uploading their OTL data, along with student performance results, to get a unique picture of student learning and content readiness. Click here to learn more.
Ready to begin optimizing opportunity-to-learn in your classroom, school, or district? Contact us to get started.
- Gamoran, A., Porter, A.C., Smithson, J., & White, P.A. (1997, Winter). "Upgrading high school mathematics instruction: Improving learning opportunities for low-achieving, low-income youth," Educational Evaluation and Policy Analysis, 19 (4).
- Smithson, John. (2013). "Measuring Opportunity to Learn: Benefits for Research and Practice." Presented at the 2013 Annual Meeting of the American Education Research Association, San Francisco, CA.
Center for Curriculum Analysis tools help instructional leaders keep matters at the heart of teaching and learning front and center in their efforts to bring PLCs together around new, more powerful instructional visions and practices.
"The SEC provides excellent data points which allow teachers to have meaningful discussions around curriculum, instruction, assessment, and alignment."
By completing one or more of the mini-surveys available through the CCA, PLC members generate data that is immediately (and confidentially) available through the CCA website. The data are presented in easily read graphs and charts to help put the focus on aspects of instruction and organizational culture that are of greatest interest to your professional learning community at any given time.

Imagine a district instructional leader who wants to see how English, Language Arts & Reading (ELAR) teachers in each grade band in her district compare to a state-wide sample of ELAR teachers with respect to their reliance on various instructional activities. The district has been working hard to improve instruction in small group settings, and so she has chosen to look at results from the Instructional Activities Mini-Survey in order to more closely examine student activities during small group work. When the data is called up on the CCA website, the relevant survey questions and graphic displays of results are presented for each grade band as well as for the entire district and state samples.
Mini-Surveys
Mini-Survey Questions
When students in the target class work in pairs or small groups on language arts & reading exercises, problems, investigations, or tasks, how much of that time do they:
- Answer questions in a textbook and/or complete a worksheet
- Solve problems that require novel or non-formulaic thinking
- Talk about their reasoning or thinking in analyzing texts
- Respond creatively to texts
- Analyze text to make inferences or draw conclusions
- Review assignments or prepare for a test or quiz
- Make predictions and/or generate hypotheses
- Work on an assignment, report, or project over an extended period of time
- Participate in simulations
- Work on a project in which group members engage in peer revision and editing
- Work with manipulatives to create puppet shows, plays, simulations
Survey Data
When students in the target class work in pairs or small groups on language arts & reading exercises, problems, investigations, or tasks, how much of that time do they:
- Talk about their reasoning or thinking in analyzing texts
District Data
State Data

The instructional leader is encouraged by the amount of time students in some classrooms are discussing reasoning and analyzing texts during small group work because that is something that is emphasized in the state standards. However, while some teachers are now doing this more often than they did in the past, there is some concern about the amount of variability noted across classrooms. She wonders, "Why do classrooms within grade bands vary so much in the amount of time small groups spend making sense of texts?" The results also raise a question about why students in Grades 5-8 spend significantly less time on this than students in the grade bands above and below.
The district leader looks forward to sharing the small group instructional activities data with teachers at upcoming PLC meetings and encouraging an open discussion about factors affecting their small group strategies. What new knowledge, skills, or administrative support does the ELAR PLC need to make further progress on this aspect of their instructional practice? Moving forward she plans to make some additional 'cuts' through the data to see if factors such as class size or English proficiency seem to impact small group activities.
She is glad to have the data as a jumping off point for PLC reflections.
To learn more about the CCA approach to student cognition and CCA tools that help professional communities develop a shared language and goals around instructional content, click here.
Contact us to bring the power of SEC data to your PLC.
The curriculum analysis module enables teachers to target and use assessment and performance data to keep track of student learning, judge the effectiveness of instructional strategies, and measure progress towards meeting the goals of their state's content standards.
The CAM displays detailed content descriptions of, and alignment analysis results for:
- Standards
Most major content standards, including the Common Core State Standards, are available through the SEC Content Library. The SEC content descriptions (i.e., tile charts) of standards provide a unique and detailed view of the content embedded in one or another standard at a given grade level.
- Instruction
Educators can compare the content of classroom instruction to that of standards to inform instructional decisions. The CAM includes an Alignment Analysis function that supports deeper understanding of each dimension of alignment.
- Assessment
Assessment content is described using the same tile chart format like those used for content standards. This provides a detailed view of the alignment of assessment content and classroom instruction to that of the standards simultaneously.
- Performance
Student performance can be examined in terms of its alignment to the content emphasized on assessments, as well as the content emphasized in classroom instruction and standards.
The CAM enables teachers and other instructional leaders to form strategies to improve student performance by providing data needed to optimize alignment between the content of Classroom Instruction, Assessments, and Standards.
| Recall | Procedures | Demonstrate | Conjecture | Integrate | |
|---|---|---|---|---|---|
| Number Sense / Properties / Relationships | 0.3 | 7.5 | 5.2 | 2.2 | 1.9 |
| Operations | 0.1 | 7.7 | 5.4 | 1.6 | 3.3 |
| Measurement | 1.1 | 4.4 | 1.4 | 0.7 | 1.1 |
| Consumer Applications | 0 | 1 | 0 | 0 | 0 |
| Basic Algebra | 0.1 | 7.4 | 4.9 | 2.4 | 1.8 |
| Advanced Algebra | 0 | 0 | 0 | 0 | 0 |
| Geometric Concepts | 0.4 | 3.3 | 2.2 | 0.9 | 0.5 |
| Advanced Geometry | 0 | 0 | 0 | 0 | 0 |
| Data Displays | 0 | 1 | 0 | 0.1 | 0 |
| Statistics | 0 | 1.5 | 2.4 | 2.2 | 0 |
| Probability | 1.5 | 8.5 | 6.3 | 3 | 0.4 |
| Analysis | 0 | 0 | 0 | 0 | 0 |
| Trigonometry | 0 | 0 | 0 | 0 | 0 |
| Special Topics | 0.1 | 1 | 0.4 | 0.6 | 0.1 |
| Functions | 0 | 0 | 0 | 0 | 0 |
| Instructional Technology | 0 | 0.7 | 0 | 0 | 0.1 |
| Recall | Procedures | Demonstrate | Conjecture | Integrate | |
|---|---|---|---|---|---|
| Number Sense / Properties / Relationships | 3.21 | 4.54 | 4.81 | 2.12 | 0.53 |
| Operations | 2.94 | 4.2 | 3.82 | 1.55 | 0.15 |
| Measurement | 1.1 | 2.02 | 2.02 | 1.14 | 0.77 |
| Consumer Applications | 0.92 | 0.92 | 0.85 | 0.82 | 0.77 |
| Basic Algebra | 2.2 | 3.96 | 5.46 | 3.87 | 1.79 |
| Advanced Algebra | 0.69 | 0.69 | 0.69 | 0.66 | 0.58 |
| Geometric Concepts | 1.74 | 4.35 | 3.65 | 2.47 | 1.1 |
| Advanced Geometry | 0.59 | 0.68 | 0.59 | 0.59 | 0.59 |
| Data Displays | 0.09 | 2.18 | 3.54 | 1.78 | 1.31 |
| Statistics | 0.05 | 0.41 | 0.8 | 0.31 | 0.15 |
| Probability | 0.32 | 1.11 | 1.01 | 0.32 | 0.32 |
| Analysis | 0 | 0.14 | 0.06 | 0 | 0 |
| Trigonometry | 0 | 0 | 0 | 0 | 0 |
| Special Topics | 0.08 | 0.08 | 0.08 | 0.08 | 0.08 |
| Functions | 0 | 0.04 | 0.2 | 0 | 0 |
| Instructional Technology | 0.81 | 3.54 | 0.43 | 0.41 | 0.31 |
| Recall | Procedures | Demonstrate | Conjecture | Integrate | |
|---|---|---|---|---|---|
| Number Sense / Properties / Relationships | 3.36 | 10.7 | 2.27 | 0.56 | 0.7 |
| Operations | 1.65 | 13.52 | 1.55 | 1.99 | 2.59 |
| Measurement | 0.63 | 5.74 | 1.99 | 0.09 | 1.16 |
| Consumer Applications | 0 | 0 | 0 | 0 | 0 |
| Basic Algebra | 0.65 | 14.33 | 2.73 | 1.25 | 2.04 |
| Advanced Algebra | 0.06 | 0.27 | 0.12 | 0.05 | 0 |
| Geometric Concepts | 2.87 | 6.16 | 4.21 | 1.25 | 0.83 |
| Advanced Geometry | 0.14 | 0.09 | 0.74 | 0.79 | 0.09 |
| Data Displays | 0.07 | 1.32 | 0.28 | 0.28 | 0 |
| Statistics | 0.07 | 1.57 | 0.35 | 0.35 | 0.31 |
| Probability | 0.42 | 2.92 | 0.09 | 0.28 | 0.28 |
| Analysis | 0 | 0.09 | 0 | 0 | 0 |
| Trigonometry | 0 | 0 | 0 | 0 | 0 |
| Special Topics | 1.94 | 0 | 0 | 0 | 0 |
| Functions | 0 | 0.09 | 0.14 | 0.14 | 0 |
| Instructional Technology | 0 | 0 | 0 | 0 | 0 |
| Recall | Procedures | Demonstrate | Conjecture | Integrate | |
|---|---|---|---|---|---|
| Number Sense / Properties / Relationships | 67.34 | 77.88 | 71.12 | 92.97 | 70.33 |
| Operations | 57.41 | 69.77 | 79.16 | 77.92 | 66.05 |
| Measurement | 79.73 | 68.46 | 58.9 | 53.33 | 55.92 |
| Consumer Applications | 0 | 0 | 0 | 0 | 0 |
| Basic Algebra | 68.84 | 70.92 | 83.99 | 91.77 | 58.79 |
| Advanced Algebra | 79.31 | 80.84 | 100 | 100 | 0 |
| Geometric Concepts | 78.02 | 66.71 | 78.3 | 75.23 | 62.95 |
| Advanced Geometry | 79.31 | 100 | 84.62 | 100 | 100 |
| Data Displays | 67.86 | 61.98 | 93.88 | 100 | 0 |
| Statistics | 100 | 81 | 92.86 | 90.93 | 82.36 |
| Probability | 13.46 | 67.49 | 46.15 | 80 | 11.54 |
| Analysis | 0 | 89.29 | 0 | 0 | 0 |
| Trigonometry | 0 | 0 | 0 | 0 | 0 |
| Special Topics | 79.31 | 0 | 0 | 0 | 0 |
| Functions | 0 | 77.59 | 97.32 | 88.26 | 0 |
| Instructional Technology | 0 | 0 | 0 | 0 | 0 |
The CAM tile charts for Instruction, Assessment, and Standards are similar to content maps. It may help to think of them as being analogous to a bird's-eye view of a city, with white cells representing street level, and progressively darker colors representing increasingly taller buildings. The cell color, or height of a building, corresponds to the amount of emphasis on content at the intersection of the relevant Topic Domain and Cognitive Demand category. To learn more about unpacking a content map, click here. For more information about interpreting alignment between content maps, click here.
The performance tile chart uses 4 colors to represent levels of student performance across topic and cognitive demand domains, as shown in the key next to the CAM display. Circles of varying sizes are used to represent content for which the number of relevant assessment items was too few to consider the results conclusive. A small circle in the cell indicates that the content was slightly underrepresented on the assessment, and a large circle denotes content that was assessed far too lightly to provide a reliable picture of student proficiency.
The data in the sample CAM display results for a group of Grade 7 mathematics teachers from the same district, and covers all their instruction and assessments for a series of units spanning an entire semester.
How can we use the data to better understand student performance in the context of the content of standards, classroom instruction, and assessments? Looking at the Performance chart, it is evident that students scored in the green or blue (above 85%) on the majority of assessed content. Somewhat lower scores (yellow) were seen on approximately ⅓ of all tested areas, and red flags came up in 3 places.
While green and blue cells are always nice, the importance of such results depends on factors that can be gleaned from the alignment of performance with the other charts. For example, students often performed well in content areas in which little instruction was conducted (e.g., Advanced Algebra, and Advanced Geometry). Did students get this content and skills from the limited instruction provided, or did they already have it? Why was instructional time devoted to those content domains even though they are not in the Grade 7 standards? Perhaps students would have done better with content in the cell for Number Sense/ Properties/ Relationships and Demonstrate Understanding if this area had been given some of the instructional time used for Advanced Algebra and Advanced Geometry.
The data also show that assessment content was often not well-aligned to what was emphasized in the standards and classroom instruction. For example, the assessments provided little information about student knowledge and skills related to Demonstrating Understanding in Number Sense/ Properties/ Relationships, and Operations. Teachers can make, select, or construct better assessments when they have CAM data to guide them.
Looking at areas of low student performance (i.e., the 3 red cells in Probability) it is apparent that classroom instruction and the assessments themselves underemphasized this content compared to the standards.
In contrast, an example of an encouraging data point is the green cell for Procedures in the Number Sense/ Properties/ Relationships domain. This area was emphasized in the standards and prioritized by teachers for instruction, with students subsequently performing as desired. When standards, instruction, and assessment content are aligned students experience more robust opportunities to learn, with performance typically following suit.
These are a few examples of actionable information that comes out of CAM data use. Whether it is professional communities working with aggregated data, or individual teachers using their own data confidentially for self-improvement, the CAM integrates curriculum and assessment data with performance data that offers a unique guidance system to help educators increase the effectiveness of their curricular decisions.
Contact us to gain access to the Curriculum Analysis Module.