Introducing the Personal Alignment Report
The Personal Alignment Report (PAR) provides teachers with a guided tour, through text and charts, of an alignment analysis based on their reported content coverage to the relevant content standards for their subject and grade. It is designed to assist in identifying areas of low alignment in order to inform teacher decisions about how best to insure that the content that students are given an Opportunity to Learn is in sync with state content standards.
The report centers around four summary measures of alignment; three sub-scale, and one overall summary measure. Each sub-scale focuses on one of three alignment dimensions (topic coverage, balance of representation, and cognitive demand) that make up the alignment comparison. The summary measure distills those results to a single overall alignment index (OAI). Each measure has a range of 0.00 (complete misalignment) to 1.00 (complete alignment). Understanding these measures and their implications for instruction is at the heart of the information the Personal Alignment Report is intended to convey.
Alignment Analysis Table (Click to expand)| TC | BR | CD | OAI | |
|---|---|---|---|---|
| Alignment Summary | 0.68 | 0.35 | 0.83 | 0.63 |
Note: 0.50 or higher indicates good alignment to the target for that measure.
| Number Sense / Properties / Relationships | 0.37 | 0.05 | 0.83 | 0.31 |
|---|---|---|---|---|
| Operations | 0.59 | 0.04 | 0.85 | 0.43 |
| Measurement | 0.68 | 0.07 | 0.77 | 0.52 |
| Consumer Applications | 0.8 | 0 | 0.33 | 0.33 |
| Basic Algebra | 0.53 | -0.1 | 0.8 | 0.49 |
| Advanced Algebra | 0 | 0 | 0 | 0 |
| Geometric Concepts | 0.46 | 0.03 | 0.7 | 0.34 |
| Advanced Geometry | 0 | 0.01 | 0 | 0 |
| Data Displays | 0.18 | 0.06 | 0.29 | 0.05 |
| Statistics | 0.54 | -0.04 | 0.48 | 0.37 |
| Probability | 0.57 | -0.16 | 0.7 | 0.44 |
| Analysis | 0 | 0 | 0 | 0 |
| Trigonometry | 0 | 0 | 0 | 0 |
| Special Topics | 0 | -0.02 | 0 | 0 |
| Functions | 0 | 0 | 0 | 0 |
| Instructional Technology | 0 | 0.04 | 0 | 0 |
- Topic Coverage (TC)
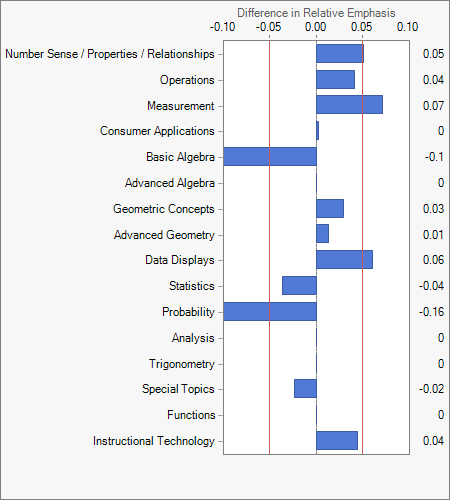
The degree of match between topics in your reported content and the topics emphasized in the standards. - Balance of Representation (BR)
The extent to which you address standards-based content compared to the relative emphasis that is devoted to that content in the standards. - Cognitive Demand (CD)
The extent to which your instruction matches the standards in terms of the level of emphasis placed on five categories of cognitive demand. - Overall Alignment Index (OAI)
A summary, multi-dimensional measure of alignment that specifies the most stringent of alignment criteria; the extent to which instruction matches the standards when measured at the intersection of what is taught, how much, and to what level of cognitive demand.
Sample Topic Coverage Chart
| Instruction | Standards | |
|---|---|---|
| Simple probability | ||
| Compound probability | ||
| Conditional probability | ||
| Empirical probability | ||
| Sampling and Sample spaces | ||
| Independent vs. dependent events | ||
| Expected value | ||
| Binomial distribution | ||
| Normal curve |
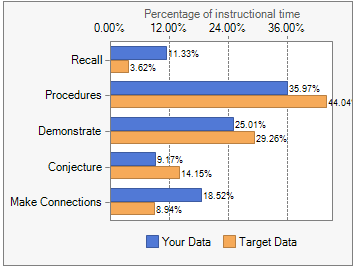
Sample Cognitive Demand Chart
Sample Balance of Representation Chart
Sample Overall Alignment Chart